A Gridded Price-Adjusted Quantity Index for Total Production of Crops for Irrigated and Rainfed Farms for the Contiguous U.S.
Price-adjusted corn-equivalent index for total production and area for irrigated and rainfed farms for more than 75,000 grid cells over the continental United States calculated for years around 2010
Listed in Datasets
Additional materials available
Version 1.0 - published on 04 Jun 2023 doi:10.13019/RQ0D-JH17 - cite this
Licensed under these terms

Description
Summary
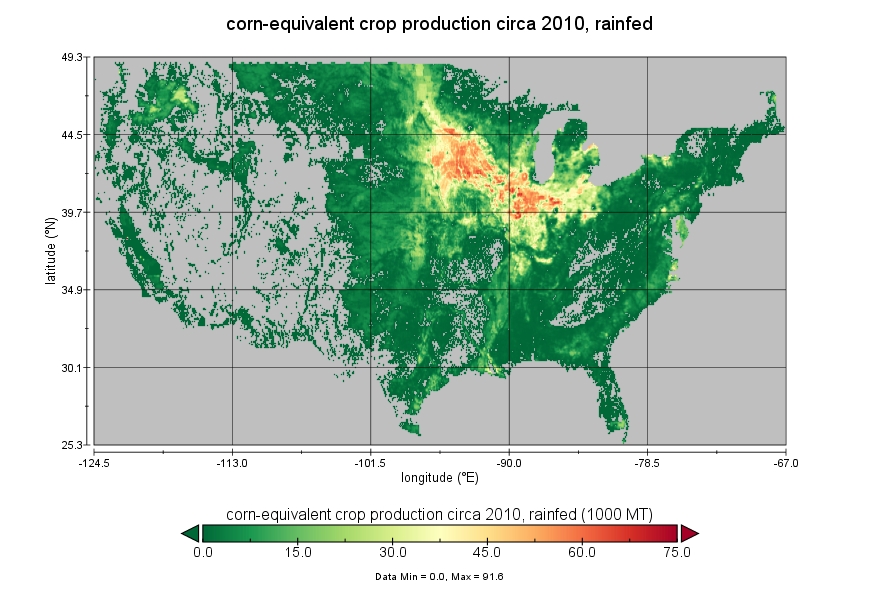
A price-adjusted quantity index is introduced for the total production of crops for irrigated and rainfed farms for the Contiguous U.S. (without crop details) at 5 arc-min resolution. Here, the production of all crops in each grid cell is aggregated into two crop composites: irrigated (QCROP_irr) and rainfed (QCROP_rfd). Each composite may have a slightly different mix of crops with different prices. To consider price differences, a “corn-equivalent” index is generated for production. The dataset also represents the cropland area for irrigated (QLAND_irr) and rainfed (QLAND_rfd) around the year 2010 provided in NetCDF, GeoTIFF, CSV, and HAR file formats.
Methods
For detailed description of methods and validations look at the Supplementary Information provided in Haqiqi et al (2023). The gridded cropland data is obtained from the United States Department of Agriculture Cropland Data Layer at 30 meters and aggregated to 5 arc-min around the year 2010 (Lark et al, 2015; Baldos et al., 2020). To split the cropland into irrigated and rainfed, the share of irrigated area is calculated for each 5 arc-min grid cell based on Moderate Resolution Imaging Spectroradiometer (MODIS) Irrigated Agriculture Datasets for the Conterminous United States (MIrAD-US) averaged over 2007 and 2012 (Brown et al, 2019). Then, the crop yields and irrigation yield gaps are obtained from the Global Crop Water Model (GCWM) based on the simulation of crop yields (Siebert and Döll, 2010; Hoff et al, 2014) for 29 crop categories (an aggregation from 175 FAO categories) and aggregated to the two crop composites: irrigated and rainfed. The county level area is adjusted based on USDA Census of Agriculture (USDA, 2014). Note that the price is fixed over the period assuming a fixed weight in calculating the corn-equivalent production (and yields). Here, price of corn is $226 per metric ton. Total production in the US is matched to FAO.
The year 2010 has been a relatively normal year for US agriculture. Thus, the spatial distribution of aggregate crop production around 2010 should be a good representative of spatial distribution of crop production in normal years for the United States. Other versions of the variables in this dataset are calculated for 2006 and 2017. This dataset provides useful information for economic studies on how land use and agriculture change over time.
The calculation is based on a biophysical model that simulates annual crop yields. To capture the average conditions, the dataset aggregates the annual data into 5-year periods. This way, the dataset can help economic models to analyze the medium-run and long-run effects. The critical biophysical information is the simulated irrigation yield gap for each location. The assumption is that the irrigated cropland does not face water stress. While both irrigated and rainfed production are affected by heat stress, the damage on irrigated crop production is smaller.
Spatial aggregation
This dataset is designed to work at a 5-arc-min resolution based on USDA CDL (30 meters) and other high-resolution datasets (250m to 10 km). The advantage of the gridded corn-equivalent approach is that it can be readily aggregated to match agronomic or hydrologic models that may operate on the scale of sub-basins or soil types. This dataset can be aggregated to national, sub-national, county-level, agroecological zones, and river basins.
Crop aggregation
This dataset provides an index for total crop production without crop details. It follows the SIMPLE-G-Allcrops model (Baldos et al., 2020). Aggregation to single-composite commodities is an appropriate approach when total land, water, and fertilizer uses are the focus of the analysis. For water quality analysis, the aggregation of crops can be redefined to include the important crops. For example, the SIMPLE-G-cornsoy model (Liu et al, 2018) is designed for water quality analysis in the US, with a composite of just two crops. While the data on production of individual crops could be helpful in some studies, it may not show the relative economic status of crop production. It would not be appropriate to aggregate various crops in tons (e.g., 10 tons of almonds may be worth more than 20 tons of beets).
Application
This dataset is designed for long-run analysis of land use and land conversion when considering a production index for aggregating crops. This data has been used in multiple studies (Baldos et al, 2020; Ray et al, 2023; Haqiqi et al, 2023). It was published first as one of the inputs of SIMPLE-G-US, on September 11, 2018, https://mygeohub.org/tools/simpleus, for version 1.0. However, users reported difficulty to extract the data from the HAR format and issues with very small values. Here, the data is made available in other formats for better access.
How to read the files
Look at the PDF file for more details.
Acknowledgements
We acknowledge support from the U.S. Department of Energy, Office of Science, Biological and Environmental Research Program, Earth and Environmental Systems Modeling, MultiSector Dynamics under Cooperative Agreement DE-SC0022141 (PCHES); the National Science Foundation HDR award # 2118329: "NSF Institute for Geospatial Understanding through an Integrative Discovery Environment (I-GUIDE); the United States Department of Agriculture AFRI Grant #2019-67023-29679: 'Economic Foundations of Long Run Agricultural Sustainability'.
References
Baldos, U.L.C., Haqiqi, I., Hertel, T.W., Horridge, M. and Liu, J., (2020). SIMPLE-G: A multiscale framework for integration of economic and biophysical determinants of sustainability. Environmental Modelling & Software, 133, p.104805, https://doi.org/10.1016/j.envsoft.2020.104805.
Brown, J.F., Howard, D.M., Shrestha, D., and Benedict, T.D., (2019). Moderate Resolution Imaging Spectroradiometer (MODIS) Irrigated Agriculture Datasets for the Conterminous United States (MIrAD-US): U.S. Geological Survey data release, https://doi.org/10.5066/P9NA3EO8.
Haqiqi, I., Bowling, L. C., Jame, S. A., Baldos, U. L., & Liu, J. Hertel, T. W., (2023). Global Drivers of Local Water Stresses and Global Responses to Local Water Policies in the United States. Environmental Research Letters. https://doi.org/10.1088/1748-9326/acd269
Hoff, H., Döll, P., Fader, M., Gerten, D., Hauser, S., & Siebert, S. (2014). Water footprints of cities - indicators for sustainable consumption and production. Hydrology and Earth System Sciences 18, 213-226, 2014. https://doi.org/10.5194/hess-18-213-2014
Lark, T. J., Salmon, J. M., & Gibbs, H. K. (2015). Cropland expansion outpaces agricultural and biofuel policies in the United States. Environmental Research Letters, 10(4), 044003. https://doi.org/10.1088/1748-9326/10/4/044003
Liu, J., Hertel, T.W., Bowling, L., Jame, S., Kucharik, C. and Ramankutty, N., (2018). Evaluating alternative options for managing nitrogen losses from corn production. Purdue Policy Research Institute (PPRI) Policy Briefs, 4(1), p.9. https://docs.lib.purdue.edu/gpripb/vol4/iss1/9
Ray, S., Haqiqi, I., Hill, A. E., Taylor, J. E., & Hertel, T. W., (2023). Labor markets: A critical link between global-local shocks and their impact on agriculture. Environmental Research Letters. https://doi.org/10.1088/1748-9326/acb1c9.
Siebert, S. & Döll, P. (2010). Quantifying blue and green virtual water contents in global crop production as well as potential production losses without irrigation. Journal of Hydrology 384, 198-217. DOI:10.1016/j.jhydrol.2009.07.031.
USDA (2014). Farm Economics, 2012 Census of Agriculture Highlights. United States Department of Agriculture, National Agricultural Statistics Service. ACH12-2/May 2014.
Content List
 Bundle(ZIP | 3 MB)
 A Price-Adjusted Quantity Index for Total Production of Crops.pdf(PDF | 403 KB)
- License terms
Cite this work
Researchers should cite this work as follows:
- Haqiqi, I., Bowling, L., Jame, S., Baldos, U. L., Liu, J., Hertel, T. (2023). A Gridded Price-Adjusted Quantity Index for Total Production of Crops for Irrigated and Rainfed Farms for the Contiguous U.S.. MyGeoHUB. doi:10.13019/RQ0D-JH17
Tags
Notes
v 1: for year 2010, at 5 arc min for the CONUS