Historical Irrigation Dataset (HID)
Supplementary materials for the publication entitled “A global dataset of the extent of irrigated land from 1900 to 2005” by Siebert et al. (2015) in Hydrology and Earth System Sciences.
Additional materials available
Version 1.0 - published on 27 Mar 2015 doi:10.13019/M20599 - cite this
Licensed under CC0 - Creative Commons
Description
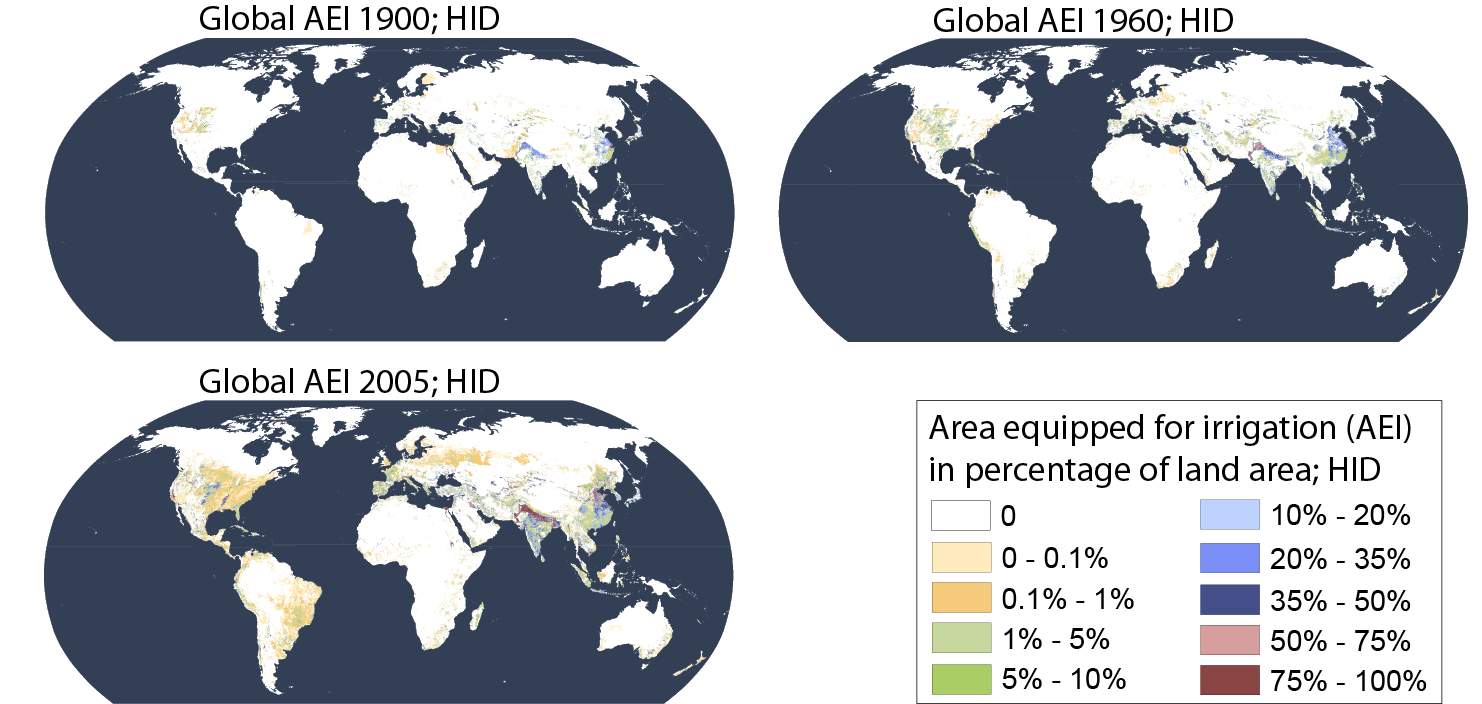
Information on the historical evolution of irrigated lands is very limited but is needed for many applications, e.g. to study changes in hydrology and water resources, crop productivity, or surface energy balances. We developed the new dataset HID (Historical Irrigation Dataset) depicting the extent of area equipped for irrigation (AEI) for 1900 to 2005 in 5 arc-minute resolution. We collected subnational irrigation statistics for this period from various sources and found that the global extent of AEI increased from 63 million ha (Mha) in 1900 to 111 million Mha in 1950 and 306 Mha in 2005. We developed eight gridded versions of time series of AEI by combining subnational irrigation statistics with different data sets on the historical extent of cropland and pasture. Different rules were applied to maximize consistency of the gridded products to subnational irrigation statistics or to historical cropland and pasture data sets.
The dataset consists of seven parts that are supplementary information to the article Siebert et al., 2015 in Hydrology and Earth System Sciences which describes the development and the analysis of the dataset in detail. The current version of the dataset is version 1.0, it differs from the previous version 0.9 released in 2014 (DOI:10.13019/M2MW2G) by the following adjustments:
- AEI in the Republic of South Africa was revised for the period 1900-1960, consequently AEI at global and regional level has changed as well for this period
- The new Supplement S6 compares AEI according to the HID with a global map showing irrigated land around year 1960 (Highsmith, 1965)
- The former Supplement S6 has changed to Supplement S7
- Supplements S1, S3, S5 and S7 have been updated
Supplement S1: Data sources for the subnational irrigation statistics used to develop the Historical Irrigation Dataset (HID) and methods used to fill data gaps in the statistics reported for each country and time step.
Supplement S2: Administrative unit ID used in the Historical Irrigation Dataset (HID) to link grid cells to subnational statistical units for each time step gridded to 5 arc-minute resolution.
Supplement S3: Area equipped for irrigation per subnational statistical unit (AEI_SU), country and world region used for each time step in the Historical Irrigation Dataset (HID).
Supplement S4: Illustration of the procedure to downscale AEI per subnational statistical unit (AEI_SU) to grid cells based on a detailed description of seven examples.
Supplement S5: AEI in the eight the gridded products of the Historical Irrigation Dataset (HID) for year 1900. The maps are presented at global scale and for two selected close-up areas, namely Western USA and South Asia.
Supplement S6: Comparison between a global map showing largely and interspersed irrigated land (Highsmith, 1965; A, B) and AEI as percentage of land area in year 1960 according to the HID (AEI_HYDE_FINAL_IR; C, D).
Supplement S7: AEI in eight gridded products of the Historical Irrigation Dataset (HID) for years 1900, 1910, 1920, 1930, 1940, 1950, 1960, 1970, 1980, 1985, 1990, 1995, 2000, and 2005 at 5 arc-minute resolution. Data are provided as ascii-grids and in netcdf format.
Content List ( Show bundle contents ) Bundle
 HID_v10.zip(ZIP | 303 MB)
 Metadata_netcdf_S2_and_S7.xlsx(XLSX | 19 KB)
Cite this work
Researchers should cite this work as follows:
- Stefan Siebert, Matti Kummu, Miina Porkka, Petra Döll, Navin Ramankutty, Bridget R. Scanlon (2015). Historical Irrigation Dataset (HID). MyGeoHUB. doi:10.13019/M20599
Geoshare

This publication belongs to the Geoshare group.