This tool version is unpublished and cannot be run. If you would like to have this version staged, you can put a request through HUB Support.
Geographic Data Viewer
Geographic Data Viewer
Category
Published on
Abstract
Geobuilder is an interactive user interface to configure the map associated with user's data including how to configure annotations, graphs, charts, photos and etc.
How to use (Step by step):
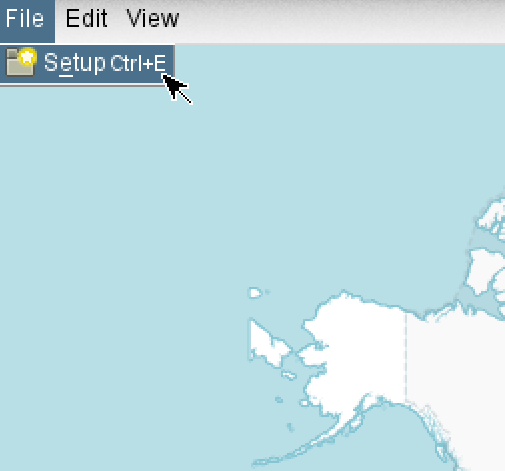
- After launching the tool, select File->Setup (as shown in the following figure) to pop up a setup menu.
- The setup menu is shown below. It contains 5 steps to set up a geographic data viewer, including
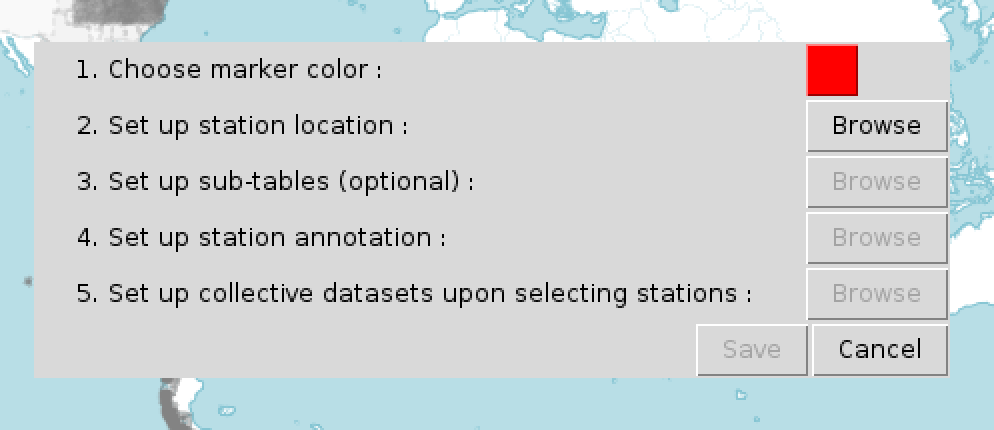
- Choose marker color:
Specify the marker color for geographic sites on the map. - Set up station location:
Step A: Select a csv file including geographical positions to draw geographic sites on the map. After selecting a csv file, the content of it will be shown in the preview table.
Step B: Select column of latitude in the table.
Step C: Select column of longitude in the table.
Step D: Press "Save" upon completion.

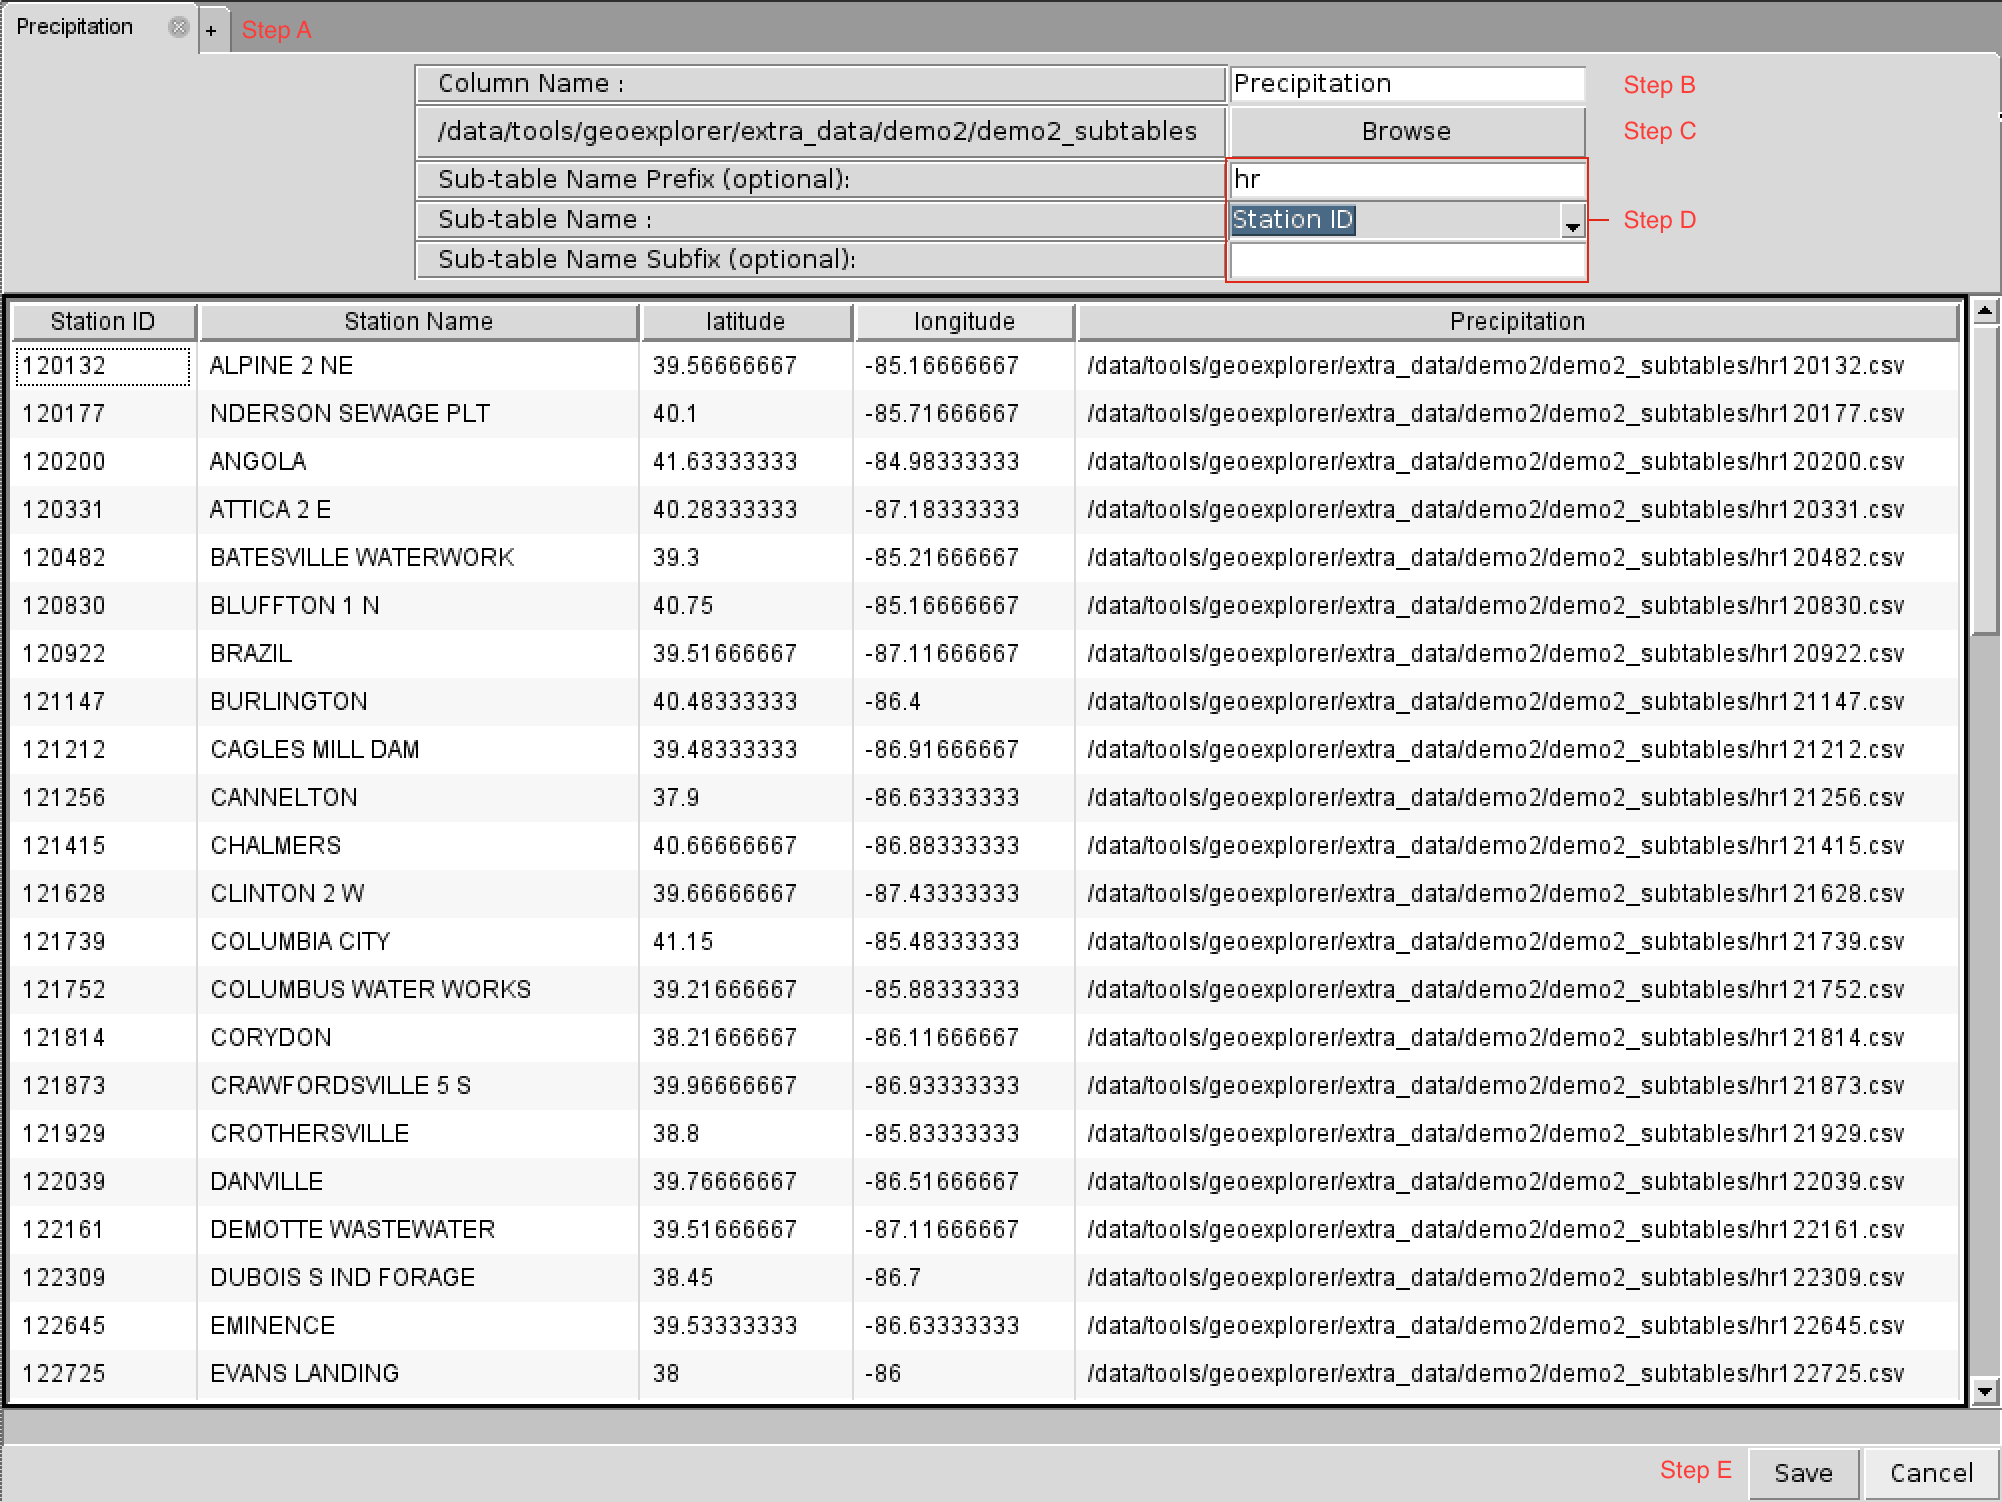
- Set up sub-tables (optional):
Support multiple csv files for data associated with geographic sites. Each row of the new column is the data in csv file associated with the corresponding geographic site.
Step A: Create a new column in the table, or
  delete an existing column.
Step B: Give column name for the current tab.
Step C: Select the folder where the sub-tables locate.
Step D: Specify file names for the sub-tables in the folder. The file name rule is [Prefix][String_of_a_column][Subfix].csv
Step E: Press "Save" upon completion.
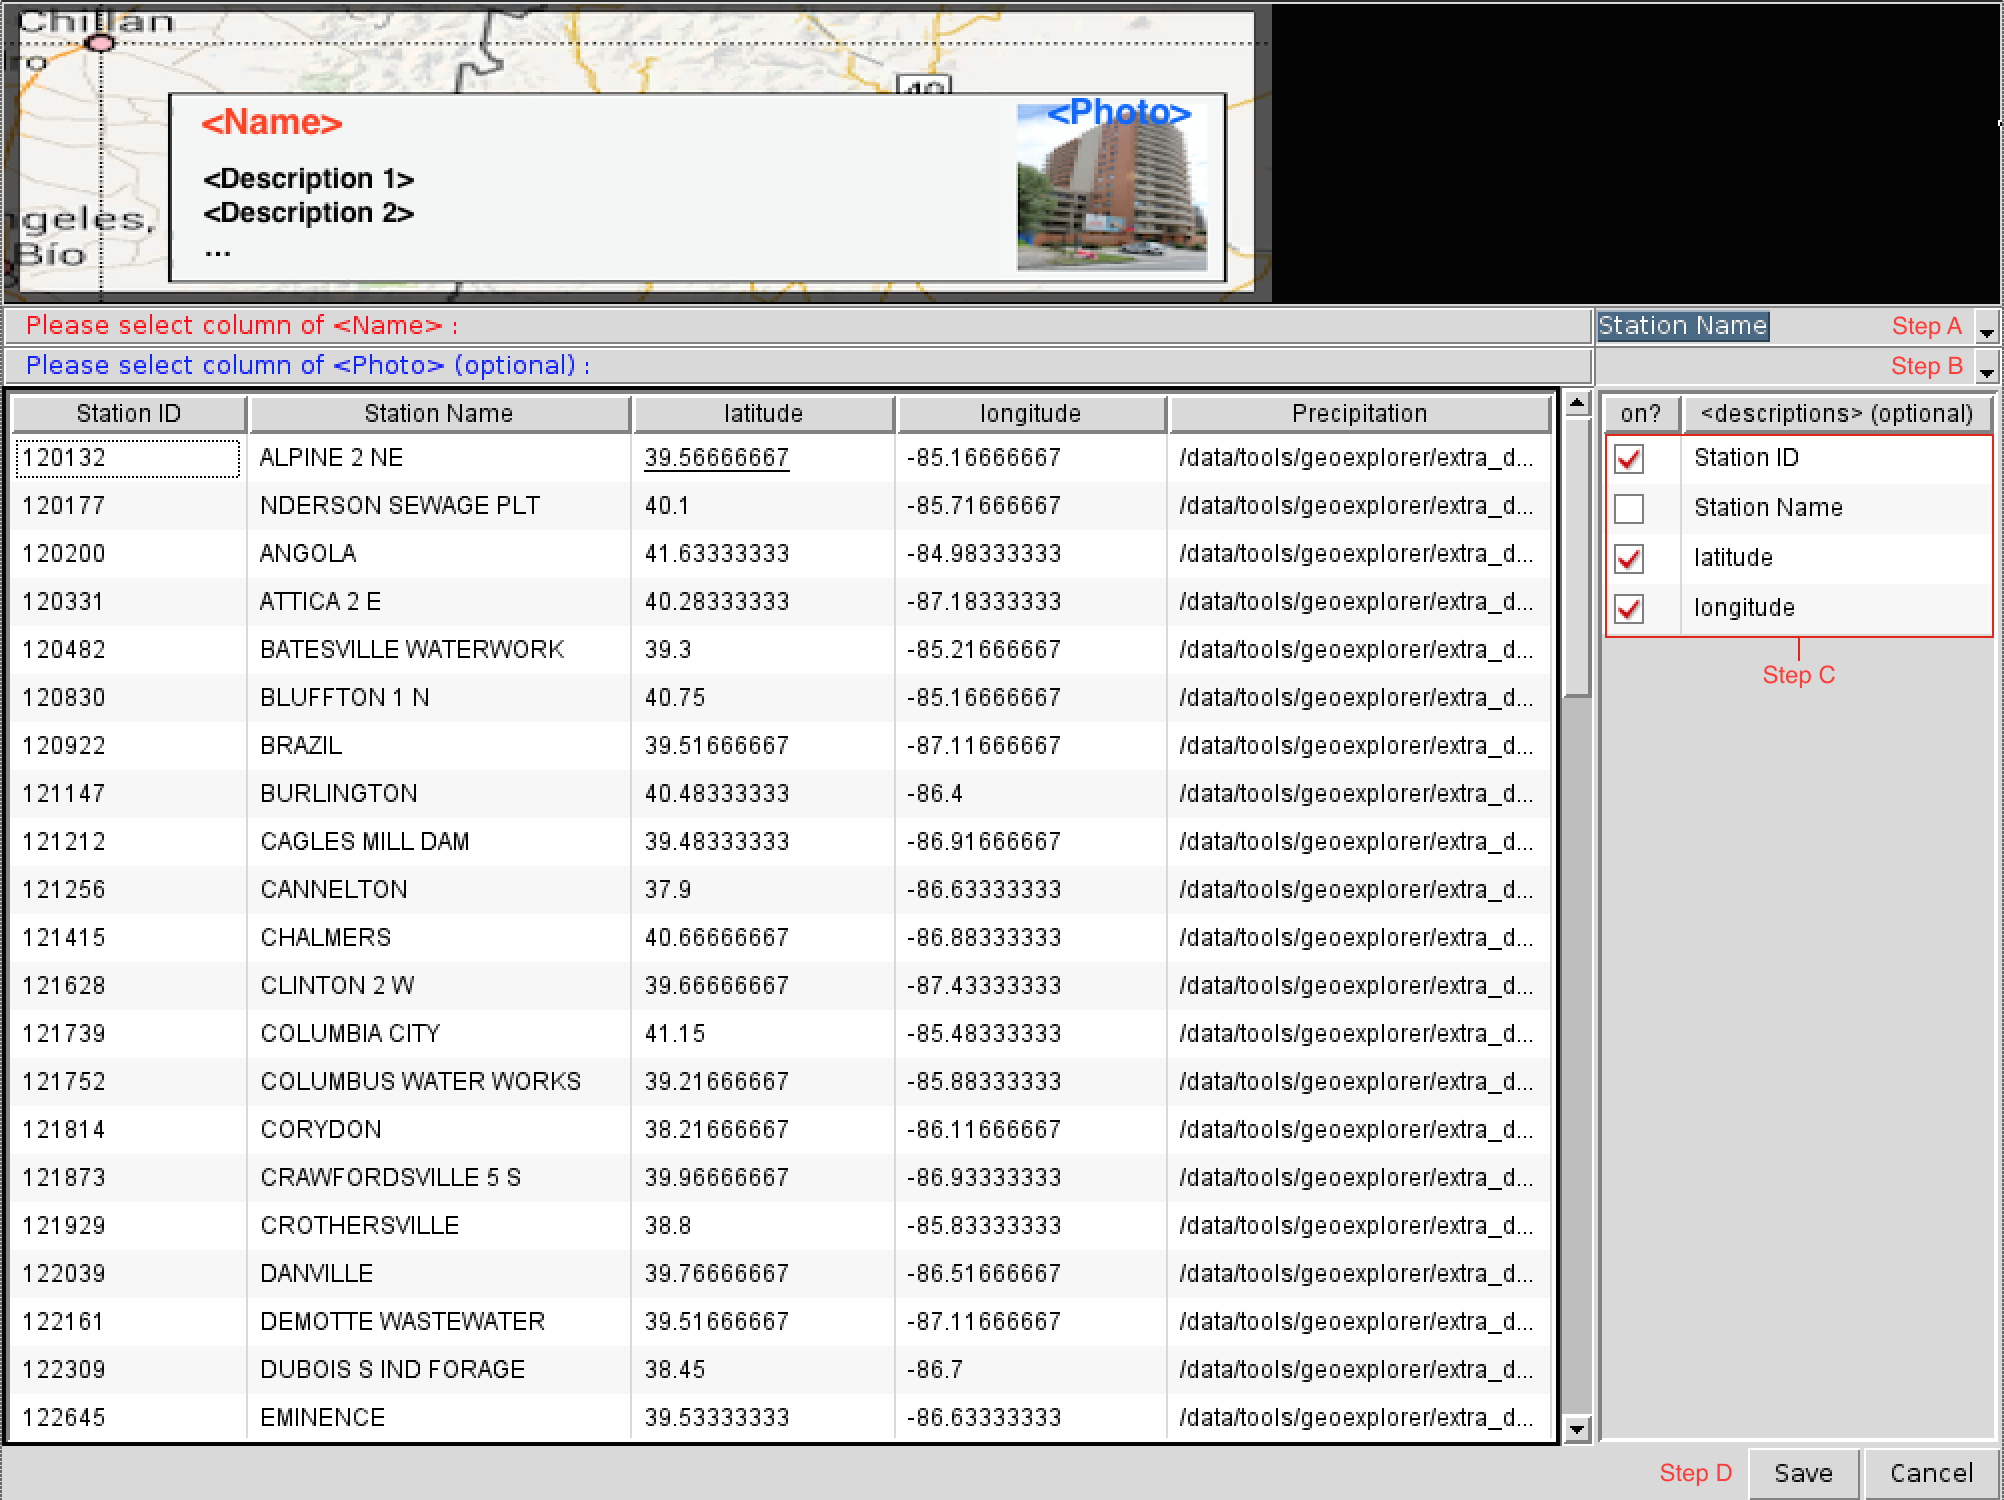
- Set up station annotation:
Annotate information while the cursor moves over geographical sites on the map.
Step A: Select column of site name in the table.
Step B: Select column of site photo in the table.
Step C: Select multiple columns of descriptions in the table.
Step D: Press "Save" upon completion.
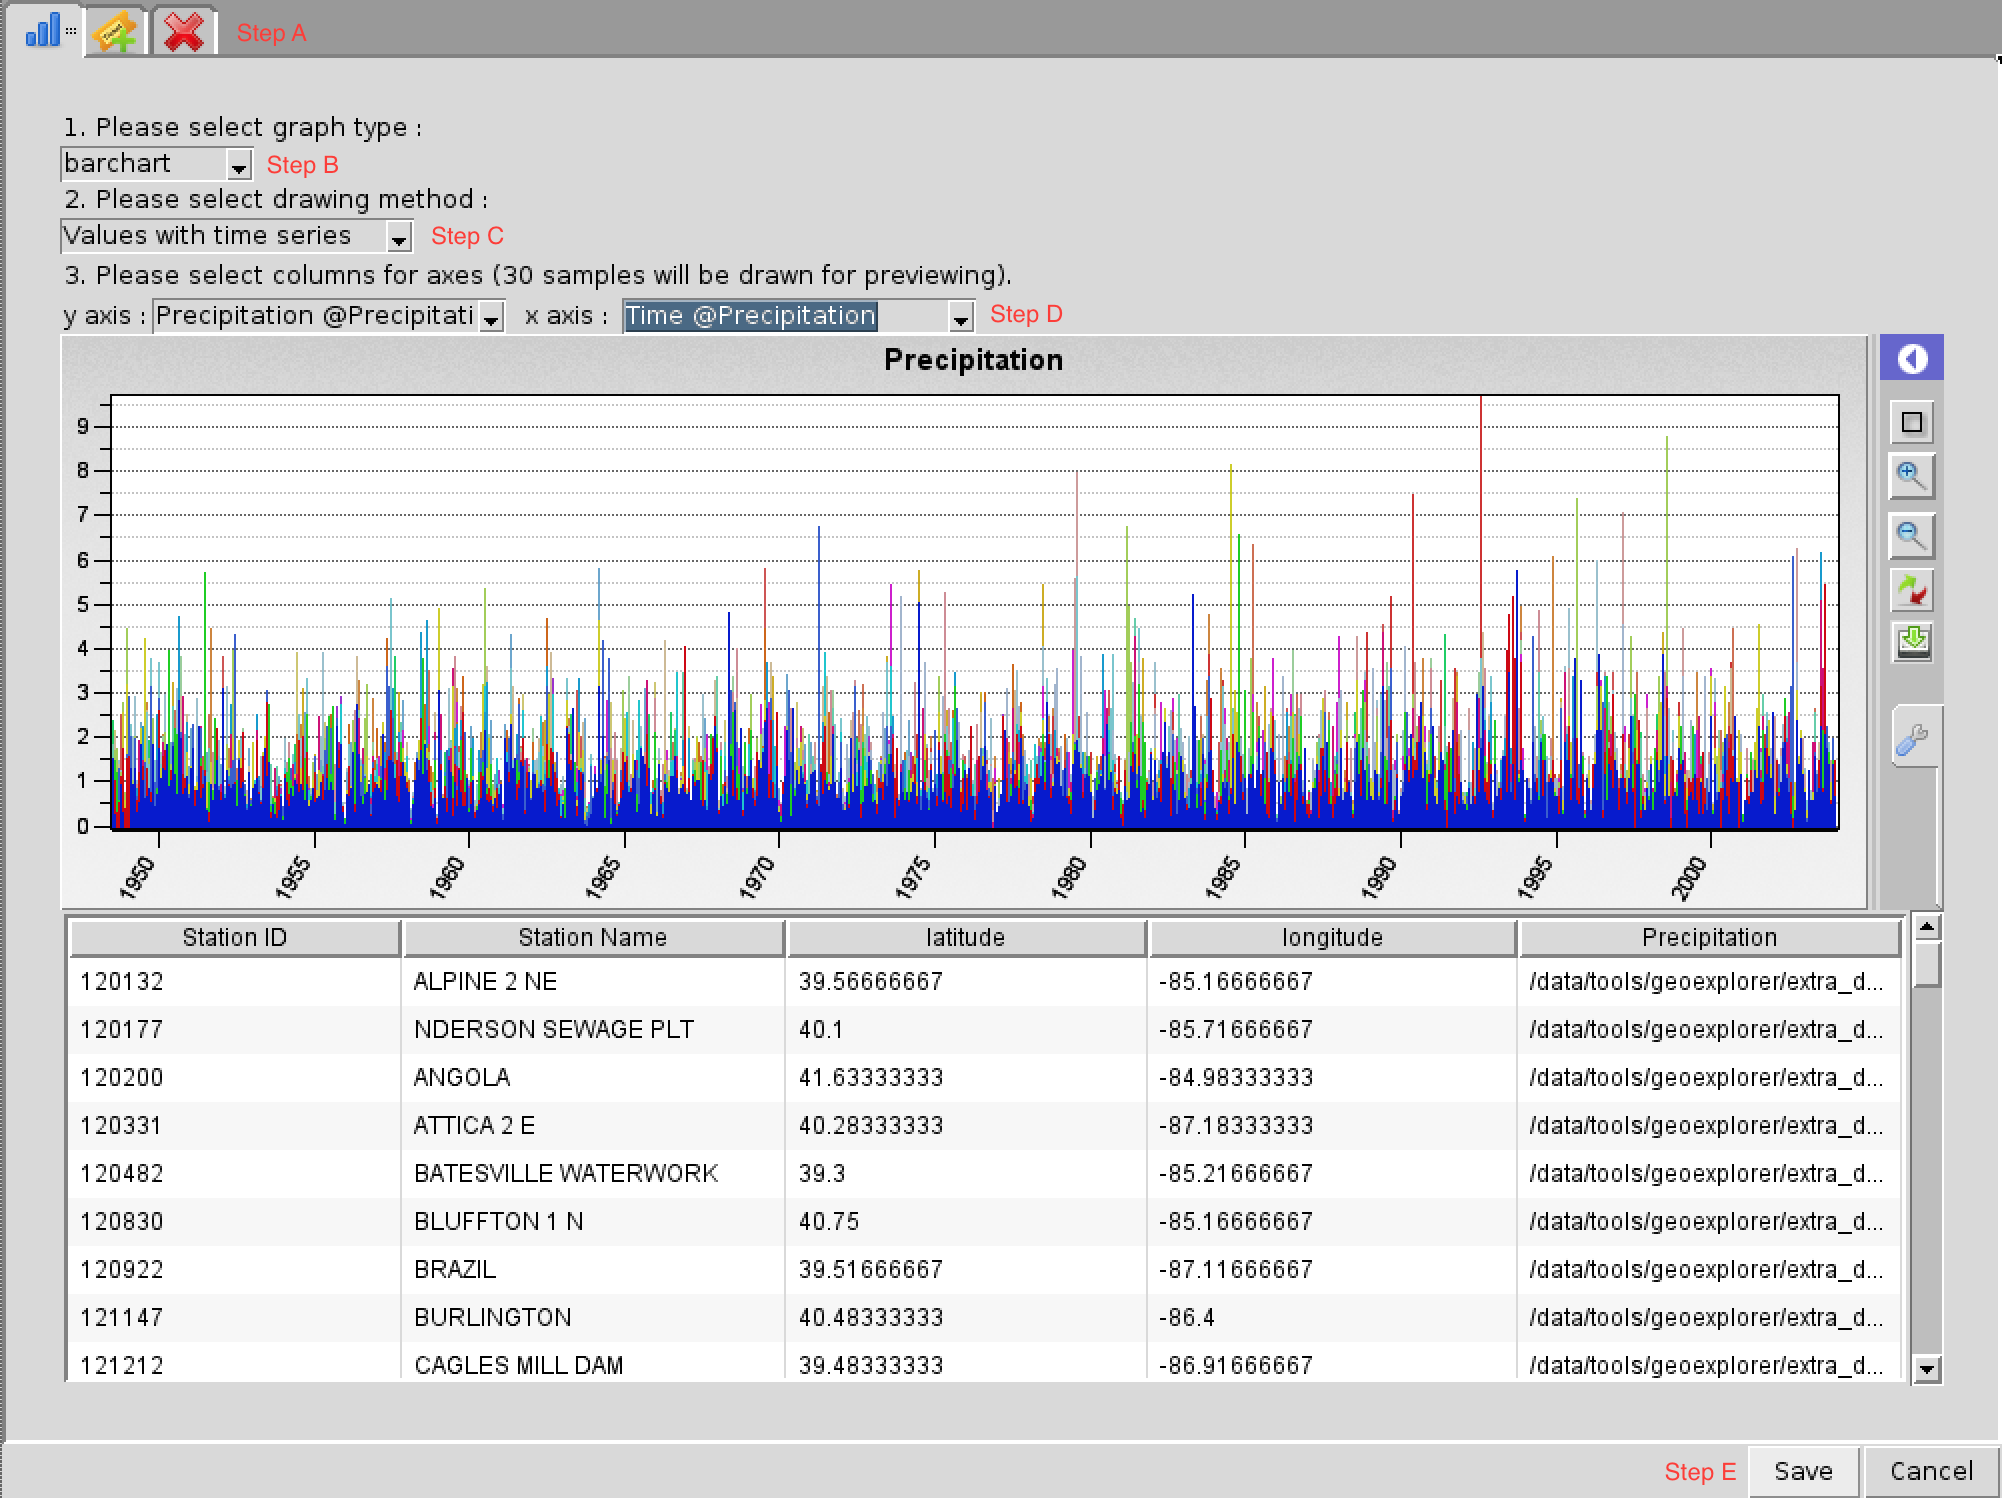
- Set up collective datasets upon selecting stations:
Upon selecting geographical sites on the map, the tool will display various types of graphs to show the data.
Step A: Create a new type of graph, or
  delete an existing one.
Step B: Select graph type, including barchart, photo, and linechart.
Step C-D: Select drawing method and columns in the table for drawing.
Step E: Press "Save" upon completion.
- Press "Save" upon completion to deploy the configuration on the map.
Cite this work
Researchers should cite this work as follows: