Transforming Climate Variability and
Change Information for Cereal Crop Producers
About Corn GDD
Contributors
Jeff Andresen, Jim Angel, Larry Biehl, Roger Elmore, Beth Hall, Chad Hart, Tom Hultquist, Ray Massey, Chris Panza, Brian Raub, Martha Shulski, Dennis Todey, Melissa Widhalm, Ray Wolf
Background
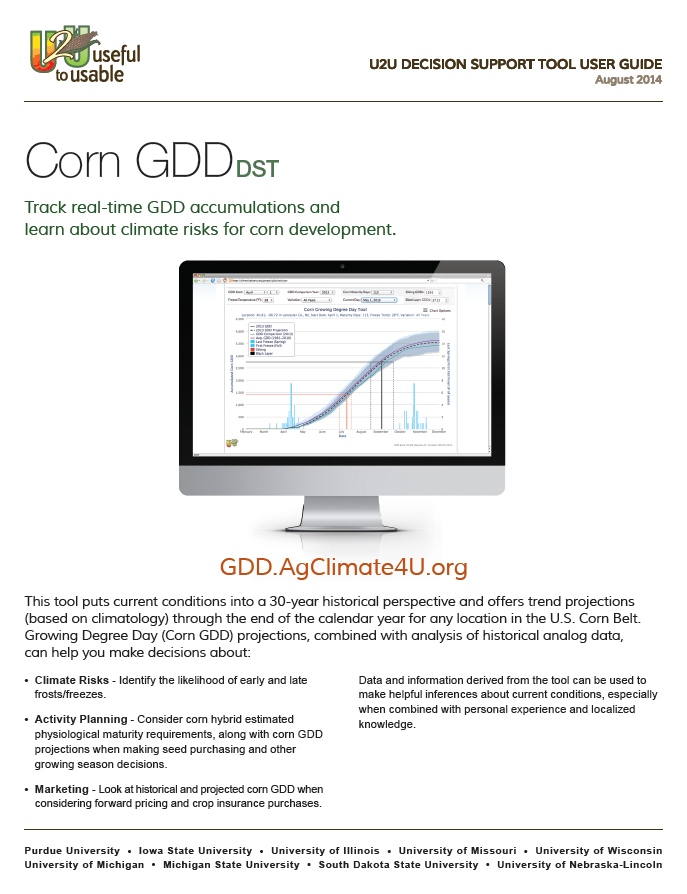
The Corn Growing Degree Day (GDD) decision support tool puts current conditions into a 30-year historical perspective and offers trend projections (based on climatology) through the end of the calendar year. GDD projections, combined with analysis of historical conparison data, can help you make decisions about seasonal climate risks, activity planning, and marketing decisions. While this tool is not meant to be a crystal ball, data and information derived from the tool can be used to make helpful inferences about current conditions, especially when combined with personal experience and localized knowledge.
Growing Degree Days (GDD) are a measure of heat accumulation within a specified temperature range. GDD are important for agriculture since they can be directly related to plant growth and development stages. GDD are sometimes also called growing degree units (GDU), heat units, or thermal time. There are many ways to calculated GDD. For the Corn GDD tool we use the 86/50 method (also called Modified GDD or Corn GDD) since it only allows GDD to be accumulated when temperature conditions are optimal for corn development (above 50°F but below 86°F).
Data Sources and Technical Details
Corn GDD Data
The Corn GDD tool uses daily gridded minimum and maximum temperature data from the Applied Climate Information System (ACIS). GDD are calculated from the gridded temperature data using the 86/50 method. Accumulated GDD GeoTIFF files were created for each year from 1981 thru the last calendar year. GeoTIFF files were also created for the average, median, minimum and maximum accumulated GDDs for the 30-year period from 1991-2020.
A script is used to download year-to-date growing degree data; the script is run just after midnight each day to keep the current year GDDs up to date. All of the data for the year is download each time the script is run. This will make allowances for any updates in prior data in the year to be taken into account.
Additional details, including example commands, formulas, and grid projection information can be found in our Details Behind the Data document.
Corn GDD Projection
The GDD Projection starts from the current day and goes through the end of the current year. The first 30-days of the GDD Projection are based on a weather model (CFSv2) forecast when that data is available from a NOAA server. The remaining projection (or all of the projection) through the end of the year is based on the 30-year (1991-2020) average rate of GDD accumulations (climatology).
The CFSv2 forecast provides daily high and low temperatures which are then used to calculate the daily GDD accumulation using the 86/50 method (updated daily). The black dashed line on the graph shows an average GDD accumulation based on 20 runs of the CFSv2 model. The grey shading around the black dashed line shows the GDD accumulation for the highest and lowest scenario from the 20 model runs. This range of values demonstrates the level of agreement among model runs, and can indicate how much confidence we have in the model forecast over the 30-day period.
The grey shading around the climatological GDD projection is based on the 30-year (1991-2020) variation in accumulated GDDs from the start of the projected period.
CREDIT: Inclusion of the CFSv2 model was made possible with assistance from Tom Hultquist (National Weather Service) and Ray Wolf (National Weather Service).
Silking and Black Layer Dates
Ray Massey of the University of Missouri provide an analysis and algorithms to determine the Silking and Black Layer dates based on accumulated GDDs since planting and the maturity days for the corn hybrid. The analysis was based on data he had on around 550 Pioneer hybrids.
Estimating Corn Growth Stages
The estimate of corn growth stage is based on ISU publication PMR 1009 entitled Corn Growth and Development. It states: Leaf appearance can be predicted from VE to final leaf (Vn) based on GDD accumulation (Figure 5). From VE to V10, a new collared leaf appears approximately every 84 GDD accumulated. Regardless of corn variety planted, leaf appearance is estimated to occur every 84 GDD. The Corn GDD product assumes crop emergence after 105 GDD, although the scientific literature states emergence can occur after 90-200 accumulated GDD depending on factors such as ground cover and tillage practices.
Calculating Freeze Probability
The Last Spring Freeze Probability (found on the Data tab) shows the number of times that the last freeze occurs after the start (planting) date based on the entire available history (1981-last year). For example, if the last spring freeze occurred after the start date 16 times in 33 years, the probability would be 16/33 or 48%
The First Fall Freeze Probability (found on the Data tab) shows the probability of the first freeze occuring before Black Layer is achieved. Purdue University statisticians were consulted for advice on calculating this probability. They recommended the following formula: P(first freeze before Black Layer) = summation_t P(freeze at t) P(Black Layer>t). Additional documentation related to the probability of freeze before black layer calculation used in the U2U GDD tool is available on the U2U website.
Tool Development Process
The following steps outline the process followed to develop the Corn GDD tool.
- - Download the minimum and maximum temperature from the ACIS web site for the U2U area for the years 1981 through last calendar year.
- - Generate the accumulated growing degree days for the year from the minimum and maximum temperature data using the 86/50 method.
- - Create a geotiff file for each year with 365 layers in the file with each layer representing a different day of the year. (Note that the 366th day for leap years is ignored; there is usually very few GDDs for the last day of the year for the area.) Do this for the growing degree day data and the minimum temperature data.
- - Create 30-year (1991-2020) average and median geotiff files for the growing degree day data.
- - Create last and first temperature threshold day-of-year geotiff files for each year and threshold temp from 25 through 35 degrees from the minimum temperature data. Create 30-year average first and last temperature threshold day-of year geotiff file for each threshold temp from 25 through 35 degrees.
- - Create (and run) script to automatically create the current year data file as the year progresses.
- - Three geotiff files in band interleaved by pixel (BIP) format are used for input to the tool: (1) 30-year average, 30-year median, yearly from 1981 thru last calendar year. (2) Day of year file with average, and yearly last and first temp thresholds for 25-35 degrees. (3) current year GDD file which is updated periodically.
- - The growing degree day tool has a map page to allow the user to select the location for the graph and a graph page which displays the GDD data for that location.
- - The verification process for the data were to obtain a plot of the min and max minimum temperature for the entire site for each day of the year. These plots illustrated a few times when the min or max minimum temperature spiked significantly during the summer for some days compared to other days around the spike. The images of the minimum temperature data were reviewed for these days. Most times a very dark area (or a very bright) area would appear in the image indicating some bad input temperature for the gridding process. This procedure was also followed for the maximum temperature. Currently only a few problems exist in single areas for 1 or 2 days in 1983, 1993, 1996, 1998, 2010 and 2012.
Frequently Asked Questions
Are data available for my location?
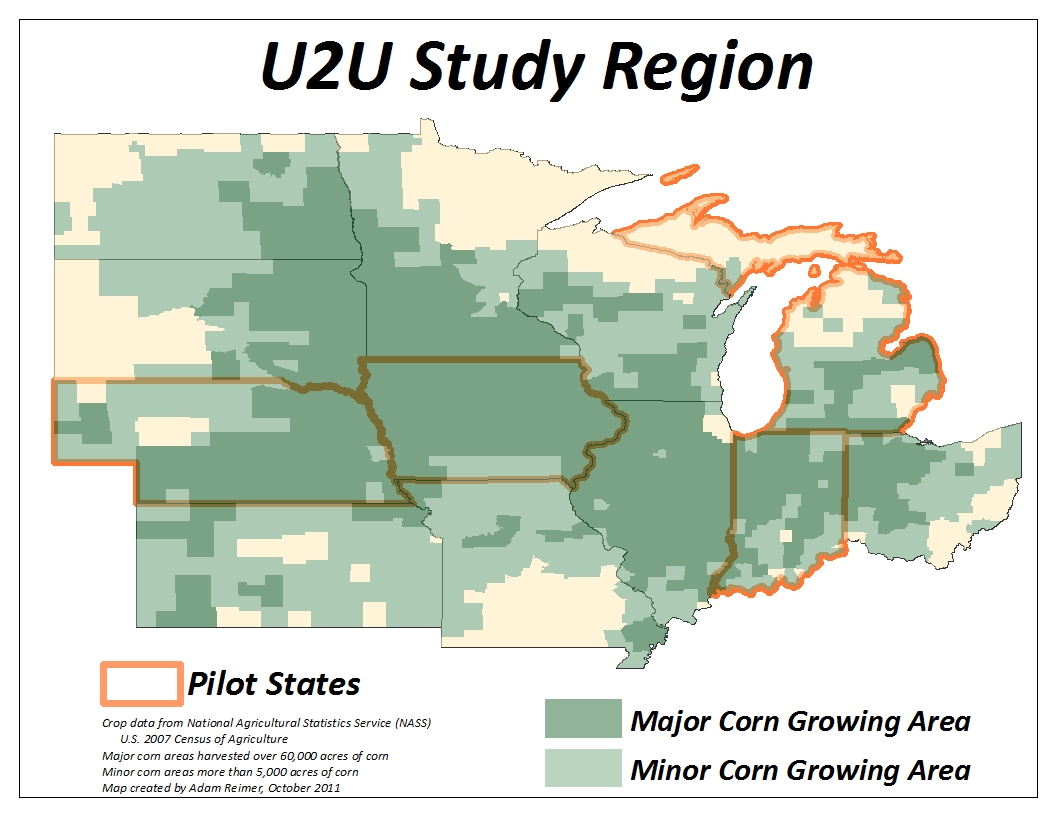
The Corn GDD tool is available for any location within the 12-state north central region of the United States. We uses high quality gridded temperature data from the Applied Climate Information System (ACIS) to achieve this level of spatial coverage. Learn more about ACIS at http://rcc-acis.org/.
What does the gray shading on the Corn GDD graphic represent?
The gray shading is showing you the possible range of GDD accumulation based on forecast and historical conditions. The lighter gray corresponds to the Avg. GDD (1991-2020) curve on the chart (purple line), and the darker gray is associated with the GDD Projection (dashed black line).
You can control the spread of the data shown with the "Variation" selection in the user input section above the chart. Selecting "All Years" will display the entire range of data, including the maximum and minimum values observed for the available period. Selecting "Middle 20 Years" will display the middle 20 years of data, removing the 5 highest and 5 lowest years from the range. Selecting "Middle 10 Years" will display the middle 10 years of data, removing the 10 highest and 10 lowest years from the range. Selecting "None Displayed" will cause no range of data to be displayed on the graph. Only the selected average, median, comparison year, and/or current/projected accumulation will be displayed.
What do the blue vertical lines on the Corn GDD graphic represent?
These lines show you the first/last freeze date for each year back to 1981. The height of the blue line tells you how many years had a first/last freeze on that exact date. If you put your cursor over the line you will get additional information about the date and year(s) associated with that line. The tallest blue line represents the average first/last freeze for the 30-year record.
By default you will see the full range of first/last freeze dates in the record. You can reduce the range of values on the graphic using the "Variation" selection in the user input section above the graphic. Note: If the current day is two or more weeks past the latest recorded spring freeze the spring freeze data are automatically turned off. To view these data simply click on "Last Freeze (Spring)" in the legend.
How is the default GDD Start Date selected?
The default GDD Start Date is based on the earliest insurable planting dates for corn (by county) based on the 2014 crop insurance records. If no data was available for a county, the default was set to April 1. This default date is not official. You should consult your local insurance advisor for more information about insurable planting dates in your location.

