Indiana Drought Information
This page includes a state version of several of the regional analyses conducted by the Midwestern Regional Climate Center (MRCC) and image products from several satellite sensors.
|
Current Information |
||||||||||||||||
|
Indiana Drought Monitor
|
Precipitation
|
|||||||||||||||
|
Multi-sensor Precipitation
|
||||||||||||||||
|
Soil moisture Note that the following has not been updated since 7/29/2015. Current information on U.S. soil moisture can be found at the NLDAS Drought Monitor Soil Moisture site. It is to be used for research or educational purposes only; it is not considered operational. ------- Soil moisture estimates based on yesterday’s data are updated in the late morning and estimates based on today’s data are updated in the late afternoon. The soil moisture amounts for three levels (0-4", 0-20", and 0-72") are calculated using a multi-level soil model responding to daily temperature and precipitation in the counties of the region. The model is designed for the growing season when temperatures are above freezing, and does not take snow depth into account during the winter. Daily estimates of precipitation are obtained from The National Weather Service Multi-sensor Precipitation Estimate product (https://www.srh.noaa.gov/rfcshare/precip_analysis_new.php). Daily temperatures are derived from the NOAA cooperative observer network. County-level soil characteristics were derived from the State Soil Geographic (STATSGO) climate division database. If necessary, missing county temperature and precipitation data are estimated using the MRCC daily gridded data. Average values of county soil moisture are computed by week with county data from 1972 to last year.
|
|
|||||||||||||||
|
Air Temperature
|
Surface Temperature Weekly composite of surface temperature as measured by the MODIS sensors on the NASA Terra and Aqua satellites.
|
|||||||||||||||
|
Stream Flow Streamflow data are reported to the USGS system in real time, with the map being a snapshot of streamflow amounts on a given day. The dots are streamflow amounts in the normal range; orange, dark red, and red are progressively lower than normal streamflows; and turquoise, blue, and black are progressively higher than normal streamflows. Even though streamflow can respond rapidly to heavy precipitation events, it may take many months of drought conditions to cause streamflow to fall to low levels, providing a good indicator of hydrological drought that may affect water supplies.
|
Crop moisture indEX The Palmer Crop Moisture Index is a very short term indicator of drought condition on a weekly time scale relevant to crop management during the growing season. Temperature and precipitation inputs are factors in a water balance model that determines whether soils have enough moisture to meet the short term needs of crops (positive value) or do not have enough moisture (negative value).
|
|||||||||||||||
|
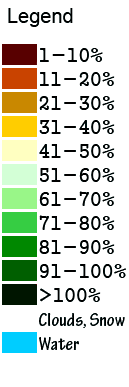
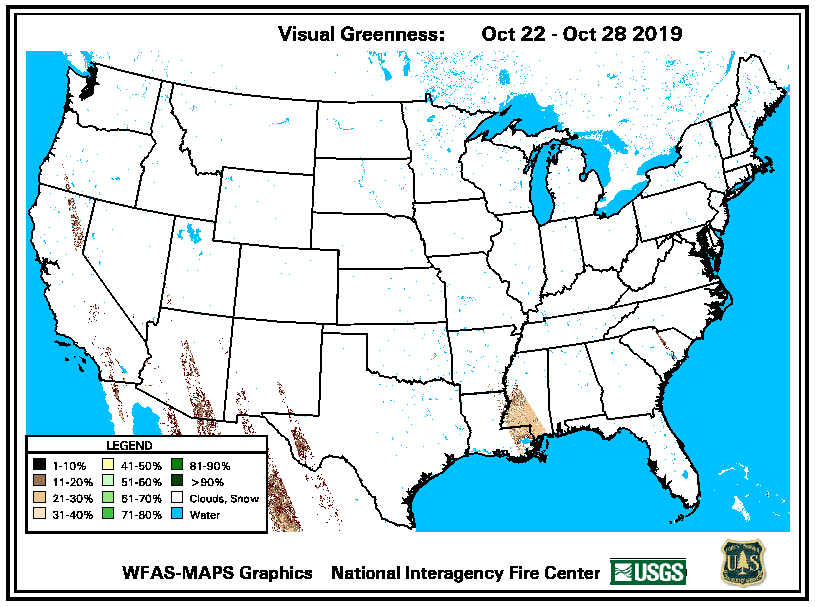
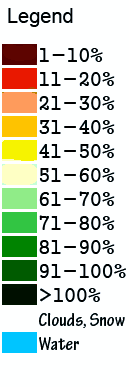
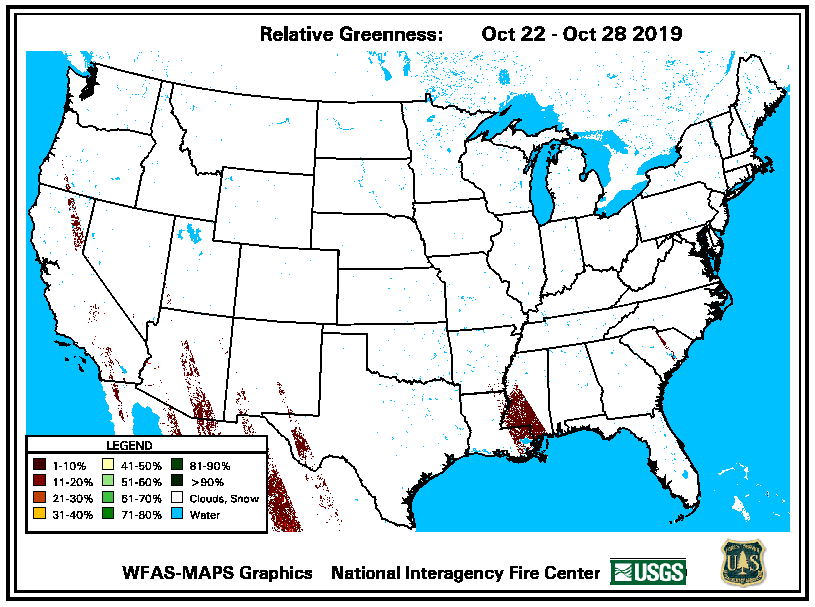
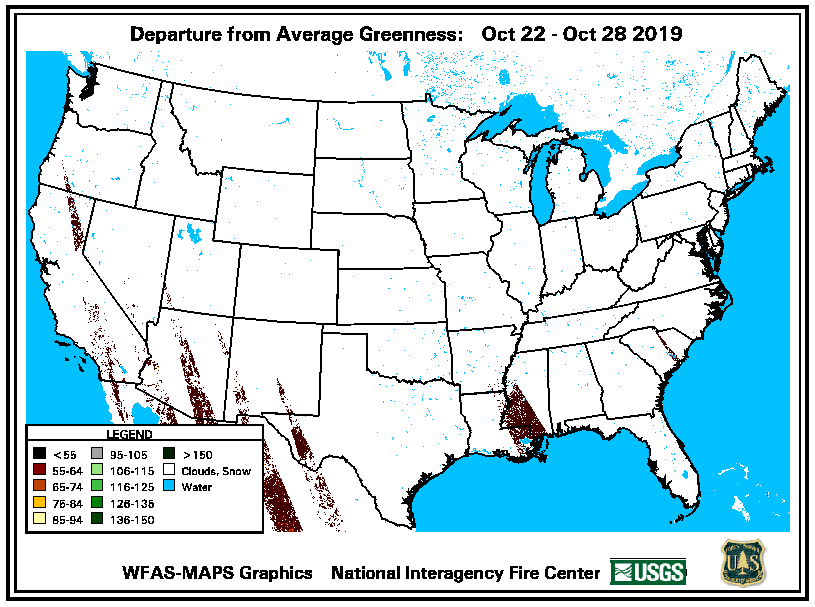
Greenness
|
||||||||||||||||
|
|
|
||||||||||||||


|
Outlooks |
|||||||||
|
|||||||||


Other Maps
CMORPH Precipitation Estimates
Other Links
State
- iClimate (Indiana)
- Texas Interactive Drought Monitor Map (Texas)
Regional - National
- National Integrated Drought Information System (NIDIS) - U.S. Drought Portal
- Midwestern Regional Climate Center (MRCC) - Midwest Climate Watch
- Climate Prediction Center - U.S. Drought Assessment
- National Drought Mitigation Center
International